
Find the operating changes worth scaling.
GrubIQ identifies recurring constraints across your stores, supports controlled tests, and follows execution to measured results—so your operations team can decide what to expand.
Up to +2 percentage pointsof operating-margin improvement.Measured in early deployments. Results vary.
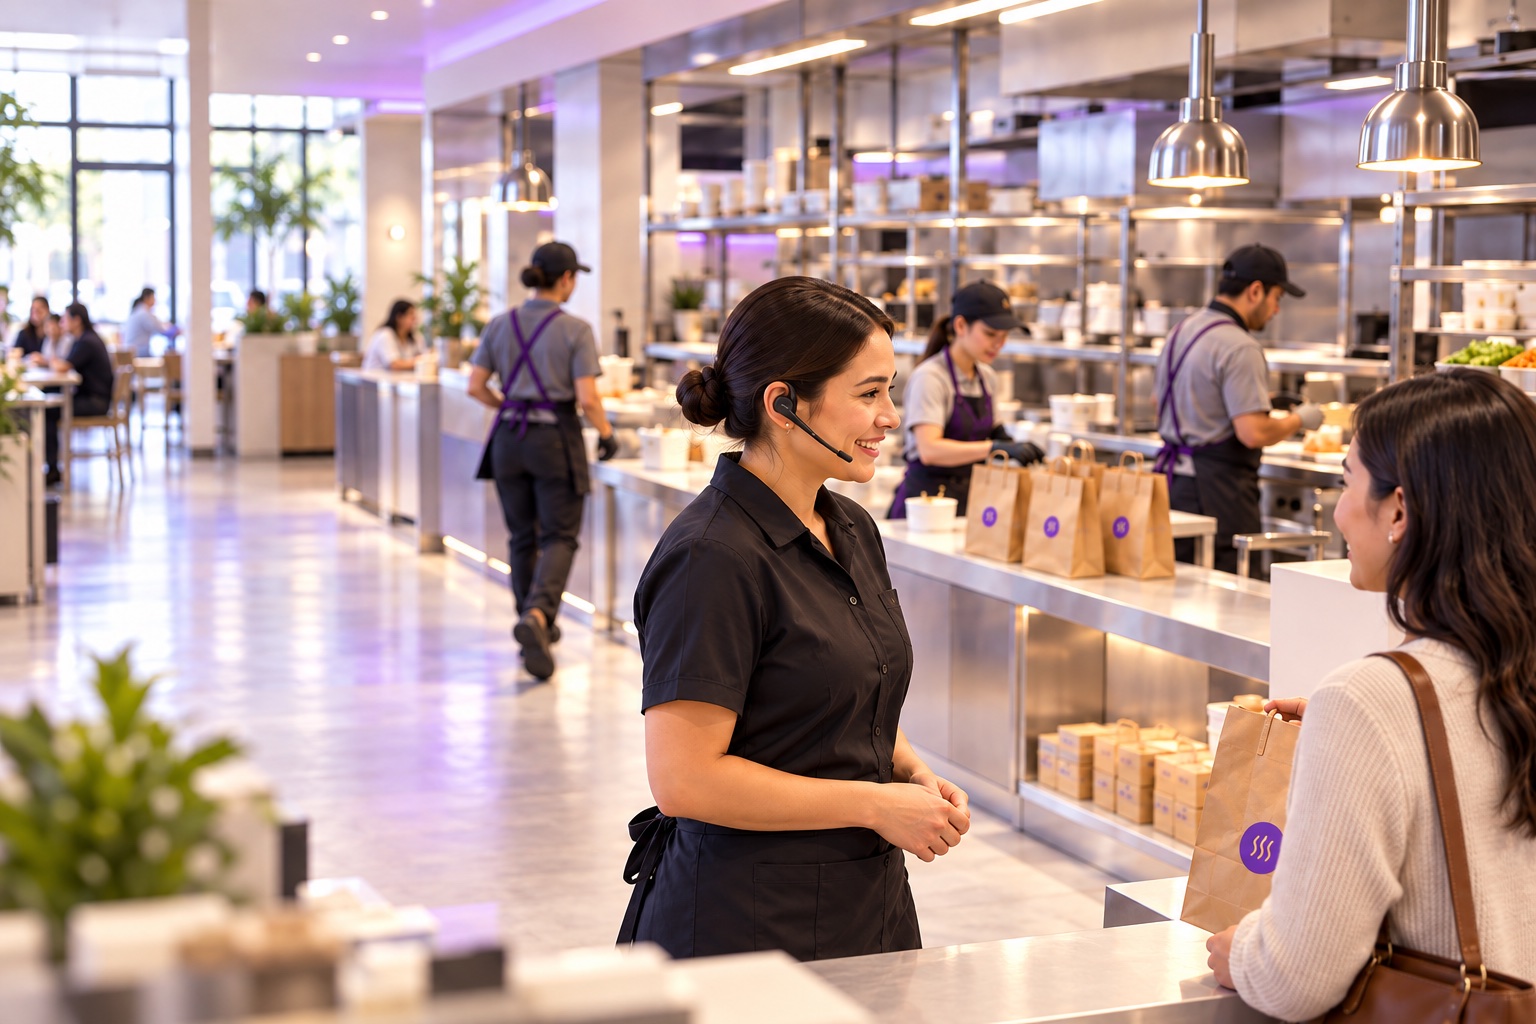
More time with your people.GrubIQ tracks the action and checks the result.
Explore what GrubIQ could mean for your operation.
Make the pattern visible. Put the change to the test.
Connect the systems your group controls. Prioritize opportunities across locations, test the operating change, and verify the result before extending it.
Illustrative enterprise scenario.
- 01
Find the pattern
Eight stores have enough labor, but support arrives at handoff too late.
- 02
Test the timing
Test deployment 15 minutes earlier across four comparable stores.
- 03
Verify before scaling
Track the move and compare throughput, handoff flow, and labor efficiency.
Match opening labor to when demand actually begins.
GrubIQ analyzed employee hours, operating hours, first sales, and the first products sold. The analysis identified a practical change to opening hours and staffing at each store.
Customer example · Three-month measurement period.
Intelligence that gets better with every shift.
Understand what happened. Model what could happen. Act on what matters now. Learn from what actually worked.
See the opportunity from day one. Once your historical data is connected, GrubIQ gives your team a clear view of operating opportunities. The depth of that view depends on the data available.
- UNDERSTAND
Historical Engine
What happened?
Find recurring patterns and potential margin opportunities in reconstructed restaurant history.
- MODEL
Time Machine
What could happen?
Explore possible decisions. Keep observed history, assumptions, and simulated outcomes separate.
- ACT
Live Execution
What should we do now?
One clear next action. Managers decide; GrubIQ tracks execution.
- LEARN
Verified Outcome
What actually worked?
Verify whether the action happened and what actually changed.
- NEXT SHIFT
Learning
What should we do next time?
Reconstruct restaurant history to find recurring constraints, operating patterns, and potential margin opportunities.
Model possible effects of different decisions. Observed history, assumptions, and simulated outcomes stay separate.
One clear next action during the shift. Managers decide; GrubIQ tracks execution.
Compare expected and actual results, verify whether the action happened, and record what changed.
Each verified decision adds State → Action → Outcome evidence, helping future models and best next actions become more restaurant-specific.
GrubIQ is learning not only what is happening inside the shift, but what should happen next—and what that decision could change.
Explore the intelligence behind the loopYour team provides access. GrubIQ handles deployment.
We coordinate integrations and data access with IT. Managers get simple onboarding focused on headset interaction and receiving actions during the shift.
For finance: connect the operating result to the economics
Review what changed, how it was measured, and what it could be worth across your stores. Historical opportunities, modeled outcomes, and measured results remain clearly identified.
A two-percentage-point operating-margin improvement on $2M in annual store revenue corresponds to $40K in annual operating profit, before GrubIQ costs. This is an illustrative calculation; results vary.
Explore the ROI assumptionsFor IT: integrations, security, and deployment
Connect POS and ordering, KDS, labor systems, and supported cameras. GrubIQ coordinates compatible systems and required data access with your team.
SOC 2 Type II, encryption in transit and at rest, SSO, role-based access, and audit logs. Edge deployment can be adapted when your setup requires it.
Review enterprise readinessFor franchisors: agree on participation and rollout
Define the systems, restaurant groups, and participating stores in scope. Align access and implementation with the teams responsible for each operation.
Discuss your franchise structureStart with a clear opportunity. Prove the operating change.
Baseline → Connect → Activate → Verify → Scale.
Agree on locations, integrations, KPIs, success thresholds, and commercial terms with your group. Use verified results to decide what to expand.